How to heatmap PPC keyword data in R
If you work at a company that uses Search Engine Marketing (SEM) for traffic acquisition, then the most important aspect of your work is analyzing how your ads perform. The success of your campaigns rely on the keywords customers are searching for.
If you want to optimize your Pay-Per-Click (PPC) ads, you need to track which keywords are performing well. I found that heatmapping my top performing keywords was super helpful. Visualizing your data can quickly give you a birds-eye view of how well your keywords are converting in relation to impressions, cost, cost-per-conversion, etc...
So, here we go.
#load libraries
library(sqldf)
library(readxl)
if (!require("RColorBrewer")) {
  install.packages("RColorBrewer", dependencies = TRUE)
  library(RColorBrewer)
}
#the dataset used here was downloaded from the Google Merchandise Store Dataset Masterview
#Google Analytics > Google Merchandise Store > 1 Master View > Adwords #> Keywords > Goal 1: Purchase Completed
#substitute with your own data
#this data was cleaned in Excel prior to import

keywords<-read_excel("~/Dropbox/Google Merch Store AdWords Keywords 20170413-20170512.xlsx")
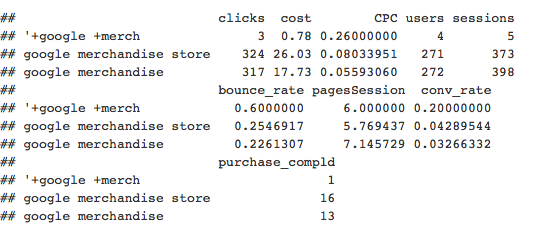
#inspect your data
head(keywords,3)

#I want to limit data to just keywords with at least 1 conversion
keywords<-sqldf('SELECT *
            FROM keywords
            WHERE purchase_compld >= 1
            ORDER BY conv_rate DESC')
#turn keywords into row names
row.names(keywords) <- keywords$keyword
NOTE: If your keywords report spans across multiple campaigns that use the same keywords, you can use the make.names() function to make each row unique like so:
row.names(keywords)<-make.names(keywords$keyword, unique = TRUE)
#drop the first column
keywords <- keywords[,2:10]>
#inspect data
head(keywords,3)
#turn dataframe into data matrix
keywords_matrix<-data.matrix(keywords)
#display all colour schemes for Rcolorbrewer palette so we can pick a color scheme for our heatmap
display.brewer.all()

#create heatmap colors using Rcolorbrewer palette
keywords_matrix<-heatmap(keywords_matrix, Rowv=NA, Colv=NA, col =                   brewer.pal(8,"Oranges"),
                scale="column",  main=" keyword heatmap")
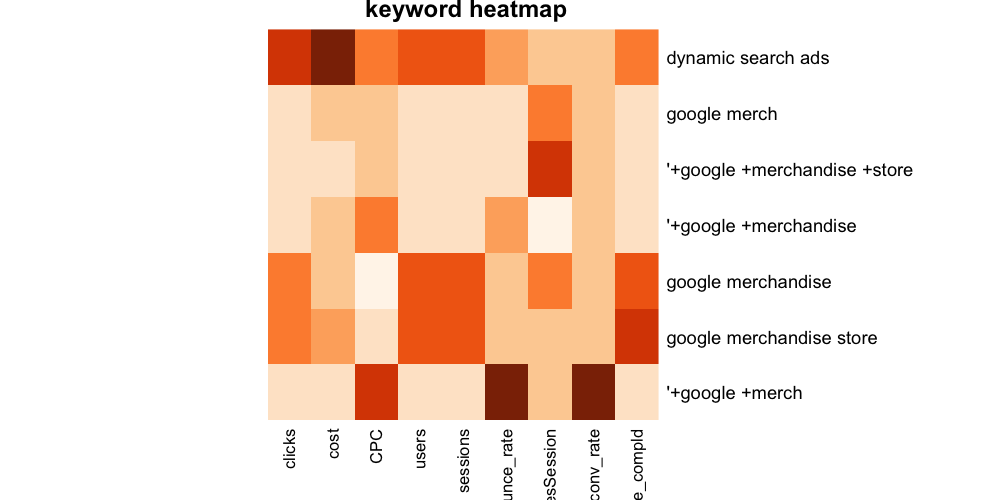
Now you have your keyword data heat mapped! Happy analyzing!