How to export your digital analytics data from R
Ok, so you've imported your data into R. Maybe you've done some on-the-fly calculations but now you want to save the export your hard-earned work from R.
Data Import
Let's start by installing the packages and libraries you will be using.
#install and load packages
if(!require("googleAnalyticsR")){
  install.packages("googleAnalyticsR")
  library(googleAnalyticsR)
}

if(!require("xlsx")){
  install.packages("xlsx")
  library(xlsx)
}
if(!require("quantmod")){
  install.packages("quantmod")
  library(quantmod)
}
if (!require("gridExtra")) {
  install.packages("gridExtra", dependencies = TRUE)
  library(gridExtra)
}
if (!require("grid")) {
  install.packages("grid", dependencies = TRUE)
  library(grid)
}
library(dplyr)
Google Analytics API Authorization
Let's authorize Google Analytics and take a look at our accounts.
#authorize Google Analytics
ga_auth()

#get account info so you can see what accounts you have access to
account_list<-ga_account_list()

#uncomment "account_list" below to review the accounts you have access to
#account_list

#assign the viewID you want to connect to the view_id variable
view_id<-113994018
For a list of the API query names visit: https://ga-dev-tools.appspot.com/query-explorer/
Query Report
Let's pull our report. I'm going to pull the equivalent of the Default Channels Report. Since I want to compare sessions from quarter 1 of this year and quarter 1 of last year, I have 2 date ranges.
#Access the default channels report
channelsReport<- google_analytics_4(view_id,
                              date_range = c("2016-01-01", "2016-03-30", "2017-01-01", "2017-03-30"),
                              metrics = c("sessions", "newUsers", "bounceRate", "pageviewsPerSession", "avgSessionDuration",
                                          "goalConversionRateAll", "goalCompletionsAll"),
                              dimensions = "channelGrouping")
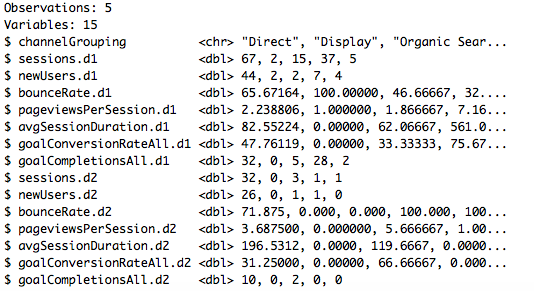
#Inspect dataset using glimpse function from dplyr package
glimpse(channelsReport)
#calculate percentage difference between number of sessions from Q1 #last year and Q1 this year using quantmod package and round to 2 #decimals
Q1overQ1change<-round(Delt(channelsReport$sessions.d1, channelsReport$sessions.d2),2)

#check results
Q1overQ1change

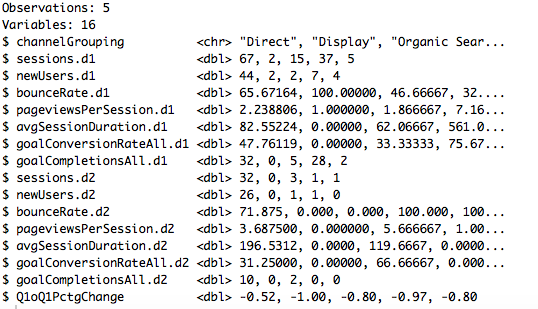
#add Q1overQ1change as a column back to the channelsReport dataframe
channelsReport$Q1oQ1PctgChange<-Q1overQ1change

#check results of new column
#the number of columns have doubled since I have
#one set of columns for the 1st date range
#and a second set for the 2nd date range
glimpse(channelsReport)
#Display results of new column as a grid using grid package
grid.table(channelsReport[c(1,16)])

Export Data
We're going to save our data to an excel spreadsheet using the xlsx package.
#Save data to an excel file
write.xlsx(channelsReport, file="channelsReportfile.xlsx", sheetName = "Channels",
           col.names = TRUE, row.names = FALSE, append = FALSE)
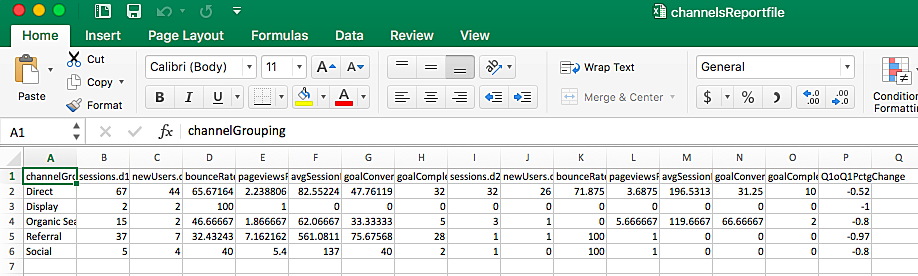
Your new file will be saved to your present working directory.

A quick glance at our excel file shows all the data we have exported from R.
All done! You can also save your data as a csv file which is a good idea if you have a particularly large dataset.
#Save as a csv file
write.csv(channelsReport, "channelsReport.csv", row.names = FALSE)
All code can also be found on R pubs. Happy analyzing!